"The earliest use of statistics came from rulers and governments, who wanted information (data), such as the number of people, resources (e.g. food, gold, land) in order to set taxes, fund infrastructure (building projects), raise and maintain armies andgo to war (Appendix 1). To make accurate decisions, ideally you would want to collect all the information or data available about a defined group or category. This is called the Population (the entire group of individuals or observations). The modern equivalent of this, is called a census or survey of the population (usually every 10 years) of a country, which collects information such as the total number of people, ethnicity, age and gender. The data obtained is called the population data. Some examplesinclude, those with a disease or condition (e.gs diabetes or hypertension), smoking, animals or plants. However, it is not practical or possible to get the population data most of the time, so we take a random sample which can be representative of the population. The sample is a defined group of individuals or observations such as smoking habits taken from an identified and specific population. The sample should be representative of the population and is chosen by setting inclusion and exclusion criteria. The inclusion and exclusion criteria define the characteristics or features of the sample. For example, inclusion criteria could be healthy, males, aged 20-30; whilst exclusion criteria participants (or subjects) not suitable for selection might be smokers, not on any medication or have a medical condition"--
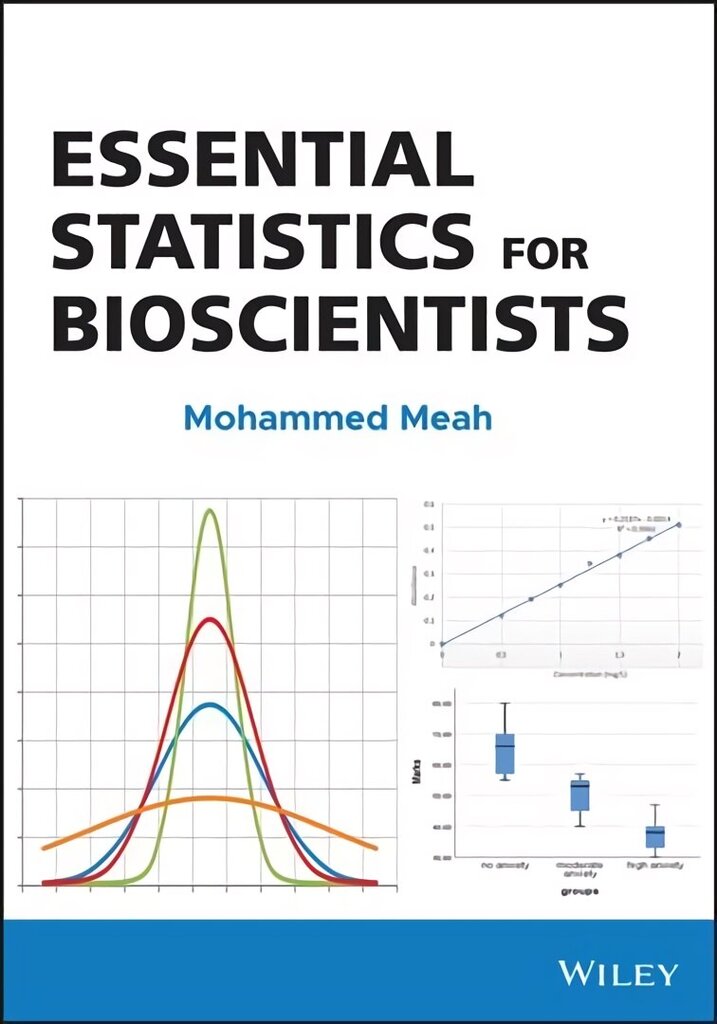
Dive into the most common statistical tests and software packages used for scientific data analysis and interpretation In Essential Statistics For Bioscientists, experienced university and bioscientist Dr Mohammed Meah delivers easy access to statistical analysis and data presentation. It is a great resource for students in the field of life and health sciences to conceptualize, analyze, and present data. This book uses three popular and commonly used statistics softwares—Microsoft Excel, Graphpad Prism, and SPSS—and offers clear, step-by-step instructions for essential data analysis and graphical/tabular display of data. Beginning with fundamental statistics terminology and concepts, including data types, descriptive statistics (central and spread of data), exploratory statistics (graphical display) and inferential statistics (hypothesis testing and correlation), the content gradually builds in complexity, explaining which statistical test is best suited and how to perform it. A thorough introduction to basic statistical terms and building up to an advanced level of statistical application- ideal for those new to study of statistics Extensive application of three popular software packages- Microsoft Excel, Graphpad Prism and SPSS Numerous hands-on examples of performing data analysis using Microsoft Excel, Graphpad Prism, and SPSS Considers the limitations and errors of statistical analysis Essential reading for those designing and planning a research project in Biosciences Perfect for undergraduate students in the life and health sciences, Essential Statistics For Bioscientists will also earn a place in the libraries of anyone studying medicine, nursing, physiotherapy, pharmacy, and dentistry requiring a refresher or primer on statistical fundamentals.
